
What’s in Southern Utah’s Drinking Water? Local Test Results Explained.
Southern Utah's drinking water contains more than just minerals. Public testing in Washington County documents arsenic, fluoride, dissolved solids, and substances formed during water treatment.
We compared local water quality reports with EPA standards, national data, and Environmental Working Group (EWG) health guidelines to see what the results actually mean.
KEY TAKEAWAY
Southern Utah's reported water quality varies by source and municipality. Water can meet federal drinking water standards while still containing measurable substances that homeowners may prefer to filter.
St. George's historical arsenic average, for example, was substantially higher than the national utility average, even though the reported average was below the federal limit. [3]
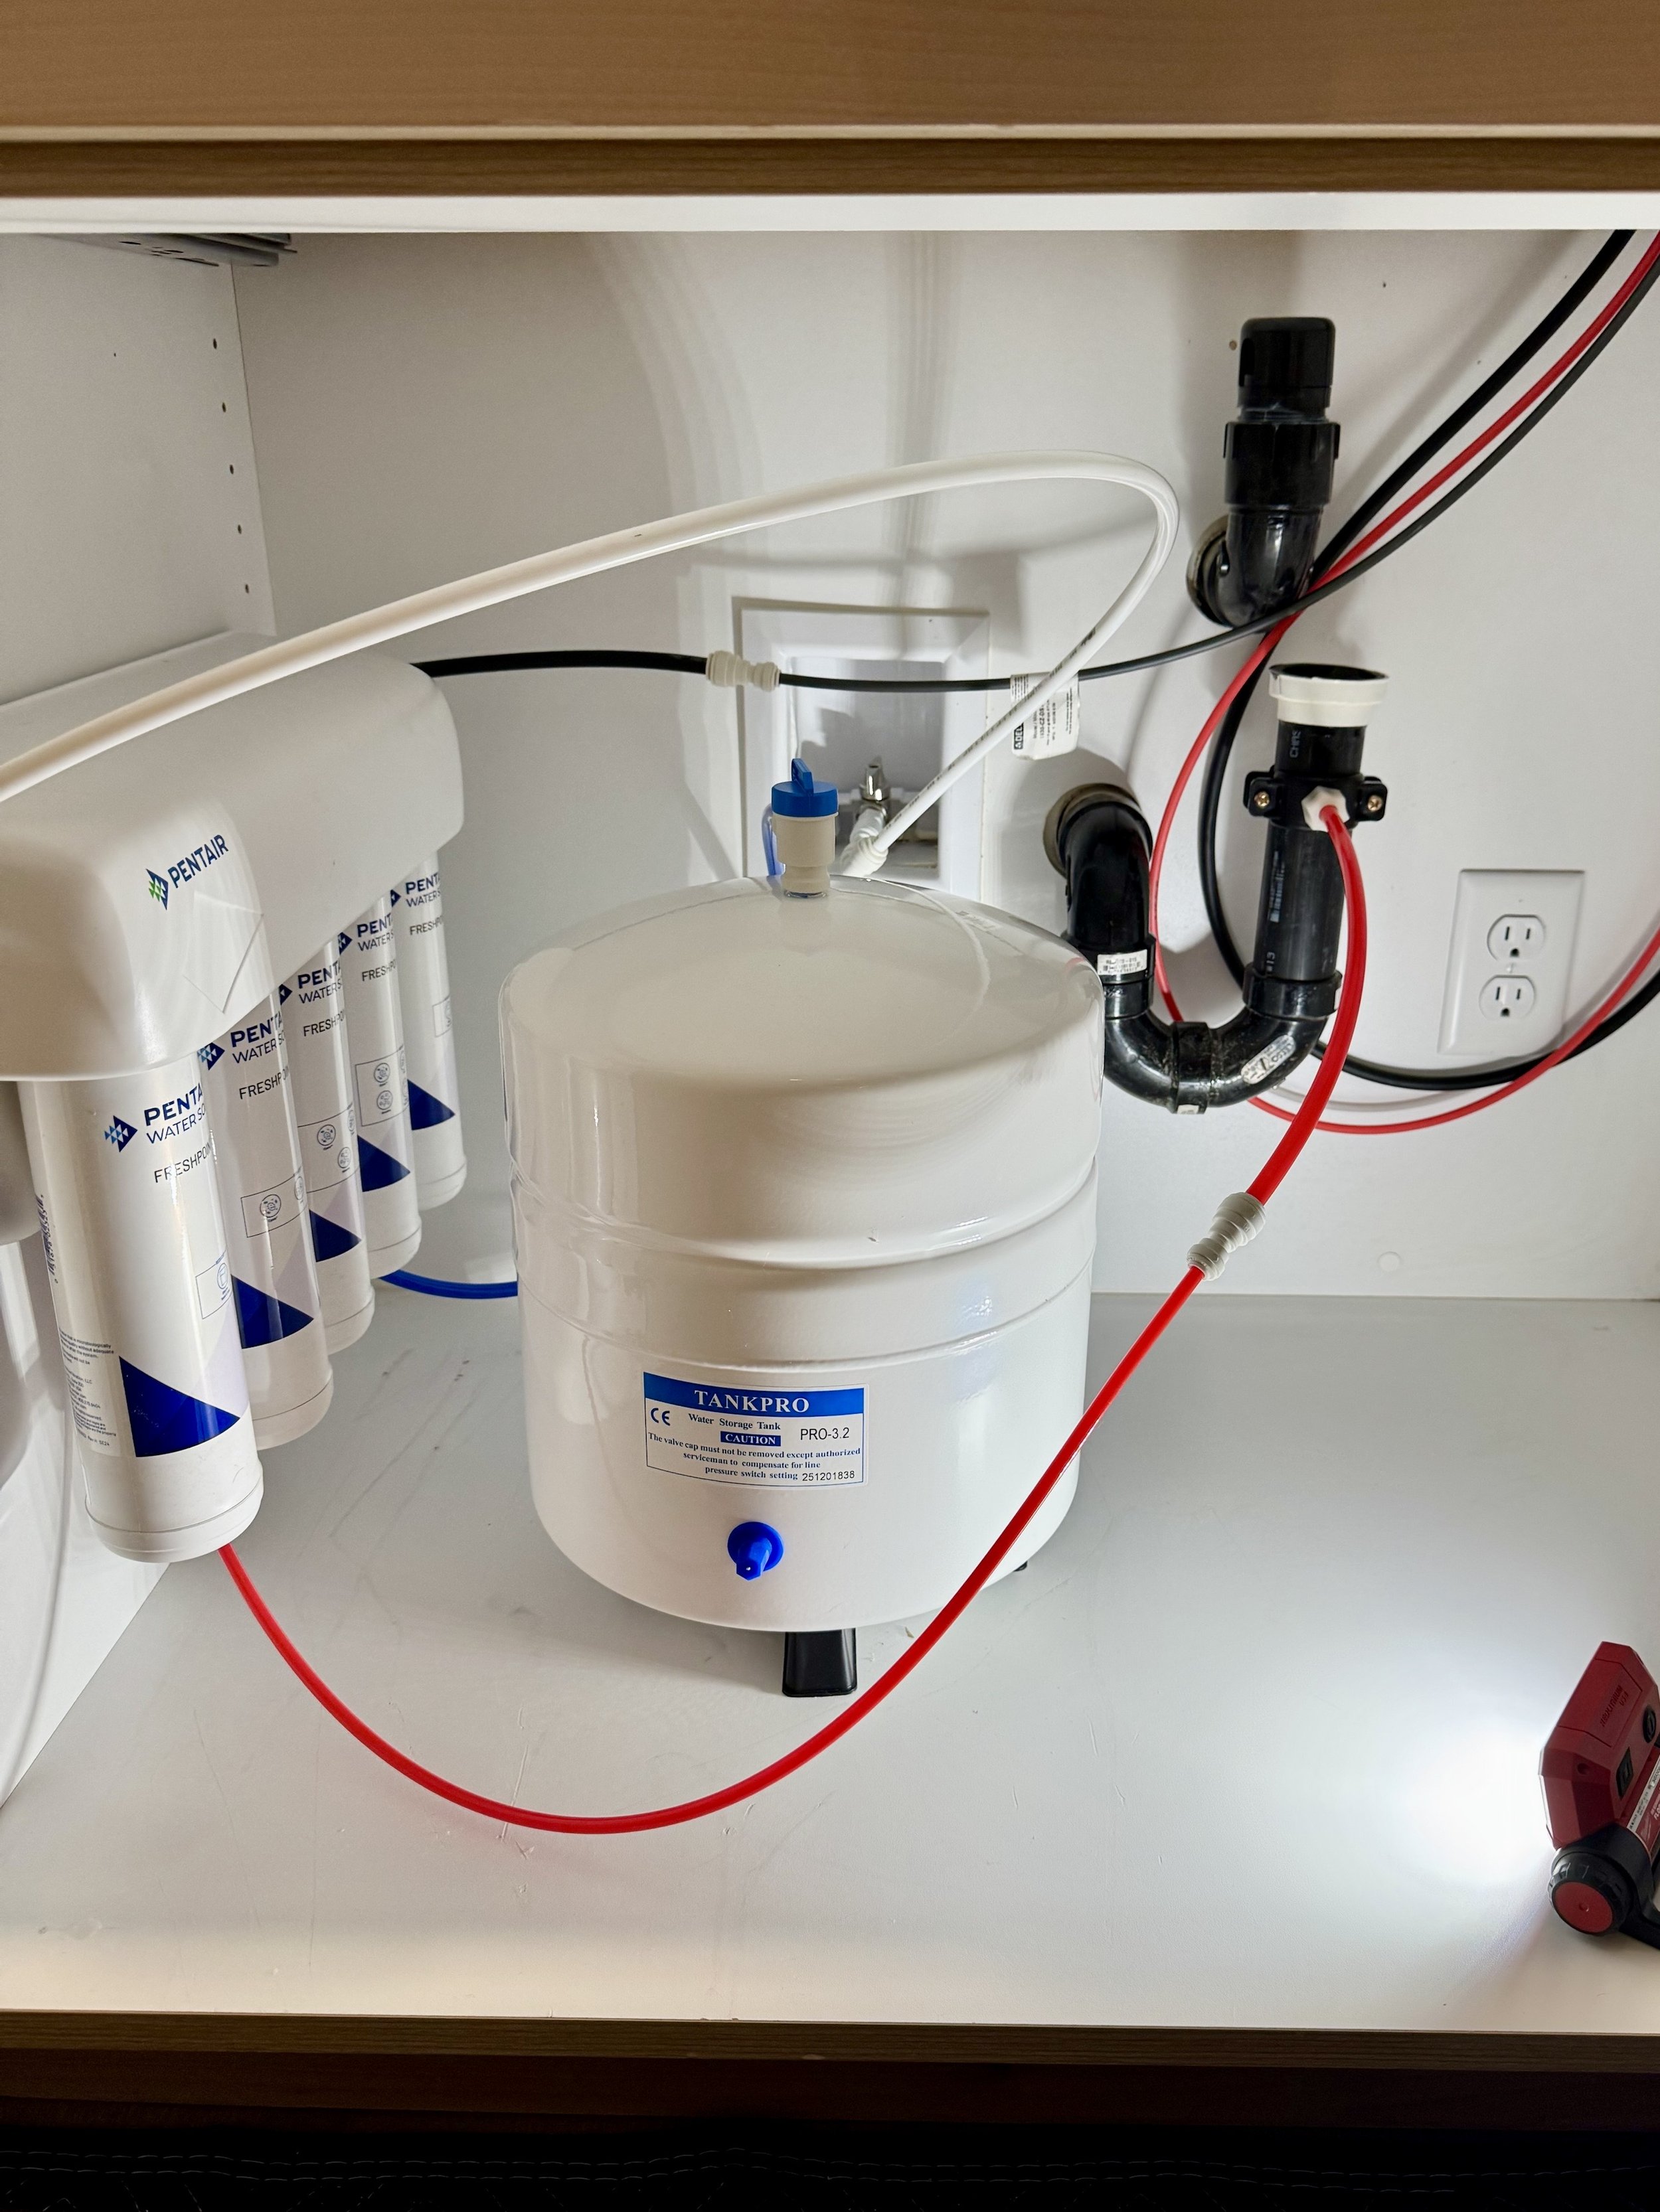
Pentair reverse osmosis drinking water system installed by Artisan Plumbing in Southern Utah.
What Do Washington County Drinking Water Reports Show?
The 2025 reports from Washington City and Ivins provide a snapshot of several commonly discussed drinking water contaminants.
Arsenic
Washington City: 1.3–3.8 ppb
Ivins: 1.0–8.5 ppb, reported as running annual averages
EPA limit: 10 ppb
Fluoride
Washington City: 0.028–0.253 ppm
Ivins: Not detected to 2.12 ppm
EPA primary limit: 4 ppm
Total Dissolved Solids
Washington City: 210–656 ppm
Ivins: 118–936 ppm
EPA secondary guideline: 500 ppm
Total Trihalomethanes
Washington City: 5–48 ppb
Ivins: 5.9–12.6 ppb
EPA limit: 80 ppb
Sources: Municipal water quality reports and EPA standards. [1, 2, 5]
These results combine measurements from different water sources and sampling locations. They do not represent the exact water quality at every household faucet.
Arsenic: How Does Southern Utah Compare?
Arsenic occurs naturally in some groundwater. Several local supplies use treatment or blending to reduce concentrations before water reaches customers. [2]
EWG's historical data provides a national comparison for 2021–2023:
St. George: 9.58 ppb
Washington City: 2.02 ppb
National utility average: 0.624 ppb
EPA legal limit: 10 ppb
EWG health guideline: 0.004 ppb
Sources: EWG and EPA. [3, 4, 5]
St. George's reported historical average was substantially higher than EWG's national utility average.
Why is EWG's guideline so much lower than EPA's limit?
EPA's enforceable standards consider health risks and treatment feasibility. EWG uses additional health-based benchmarks, including California's public health goal for arsenic.
Exceeding an EWG guideline does not automatically indicate a federal drinking water violation. [3, 5]
These comparisons reflect historical utility data, not current measurements at individual homes.
Dissolved Minerals and Hard Water
Southern Utah's mineral content is a familiar issue for homeowners.
Total dissolved solids (TDS) measure minerals, salts, and other dissolved material. Higher concentrations can affect taste and contribute to mineral deposits.
Washington City and Ivins both reported source measurements above EPA's 500 ppm secondary guideline. That guideline primarily addresses aesthetic concerns rather than a specific health risk. [1, 2, 5]
TDS alone does not indicate whether water is safe or unsafe.
Water hardness is a separate measurement associated primarily with calcium and magnesium. A water softener addresses hardness, while drinking water filtration can reduce additional dissolved substances.
Chlorine and Disinfection Byproducts
Chlorine is used to control harmful microorganisms in public drinking water.
Ivins reported chlorine concentrations of 0.1–0.4 ppm in 2025, below EPA's maximum residual disinfectant level of 4 ppm. [2, 5]
However, chlorine and other disinfectants can react with naturally occurring material in water, forming disinfection byproducts.
One group, total trihalomethanes (TTHMs), has an EPA limit of 80 ppb.
EWG's historical comparison shows:
St. George average: 35.4 ppb
National utility average: 29.1 ppb
EWG health guideline: 0.15 ppb
These figures reflect 2021–2023 testing. [3]
Disinfection serves an important public health purpose. Some homeowners nevertheless choose additional filtration for the water they drink.
Is Fluoride Added to Southern Utah's Water?
Utah prohibited adding fluoride to public drinking water beginning May 7, 2025. [6]
Fluoride can still occur naturally in groundwater.
Ivins City confirms that it does not add fluoride. Its 2025 report includes source measurements reaching 2.12 ppm. [2]
EPA's primary fluoride limit is 4 ppm, while its secondary threshold is 2 ppm.
The city's reported maximum does not mean every home receives water at that concentration. [2, 5]
PFAS and Microplastics: What Do We Know?
PFAS, often called forever chemicals, are manufactured compounds found in various consumer and industrial products.
Ivins participated in EPA's national monitoring program in 2024. Its report states that none of the 29 PFAS compounds tested were detected. Lithium was detected at concentrations reaching 180 ppb. [2]
A nondetection means a substance was not detected above the applicable reporting threshold. It does not necessarily establish absolute zero.
Microplastics remain a testing gap.
We did not identify published quantitative microplastics measurements in the municipal reports examined.
EPA's 2023–2025 national monitoring program covered 29 PFAS compounds and lithium, not microplastics. [7]
The available reports therefore cannot establish whether microplastics are present or absent in local drinking water.
What Can Southern Utah Homeowners Do?
Municipal reports provide valuable information, but they cannot establish the exact contaminant concentrations at an individual household faucet.
Homeowners can identify their water supplier, review its latest testing results, and consider testing their own drinking water.
For those interested in additional filtration, a properly selected reverse osmosis system can reduce specific contaminants and dissolved substances. The reduction capabilities depend on the system's certification and performance. [8, 9]
Reverse osmosis can supply filtered water for drinking, cooking, refrigerator dispensers, and ice makers, depending on the system's capacity and plumbing configuration.
Understanding your water gives you the information needed to decide whether additional filtration makes sense for your home.
Sources and Research Methodology
This article was researched by Artisan Plumbing using municipal drinking water reports, EPA regulations, and EWG's Tap Water Database.
Municipal comparisons use verified 2025 testing from Washington City and Ivins. St. George's national comparisons use historical 2021–2023 data.
[1] Washington City — 2025 Annual Drinking Water Quality Report
https://washingtonutah.gov/publicworks/water/ccr/CCR2025.pdf
[2] Ivins City — 2025 Water Quality Report, published June 2026
https://ivinsutah.gov/reports-studies/
Select the 2026 Water Quality Report.
[3] Environmental Working Group — St. George City Water System
https://www.ewg.org/tapwater/system.php?pws=UTAH27015
[4] Environmental Working Group — Washington City Water System
https://www.ewg.org/tapwater/system.php?pws=UTAH27021
[5] U.S. EPA — Drinking Water Regulations and Contaminants
https://www.epa.gov/sdwa/drinking-water-regulations-and-contaminants
[6] Utah Department of Environmental Quality — Fluoride in Utah's Drinking Water
https://deq.utah.gov/drinking-water/fluoride-drinking-water
[7] U.S. EPA — Fifth Unregulated Contaminant Monitoring Rule
https://www.epa.gov/dwucmr/fifth-unregulated-contaminant-monitoring-rule
[8] NSF — Reverse Osmosis Drinking Water Treatment Systems
https://www.nsf.org/knowledge-library/nsf-ansi-58-reverse-osmosis-drinking-water-treatment-systems
[9] U.S. EPA — Point-of-Use Reverse Osmosis Systems
https://www.epa.gov/watersense/point-use-reverse-osmosis-systems
Research note: Results may reflect different water sources and sampling locations. This article does not establish contaminant concentrations at individual addresses. Unresolved Hurricane arsenic measurements and unverified newer St. George measurements have been excluded.
Last reviewed: September 2026.
